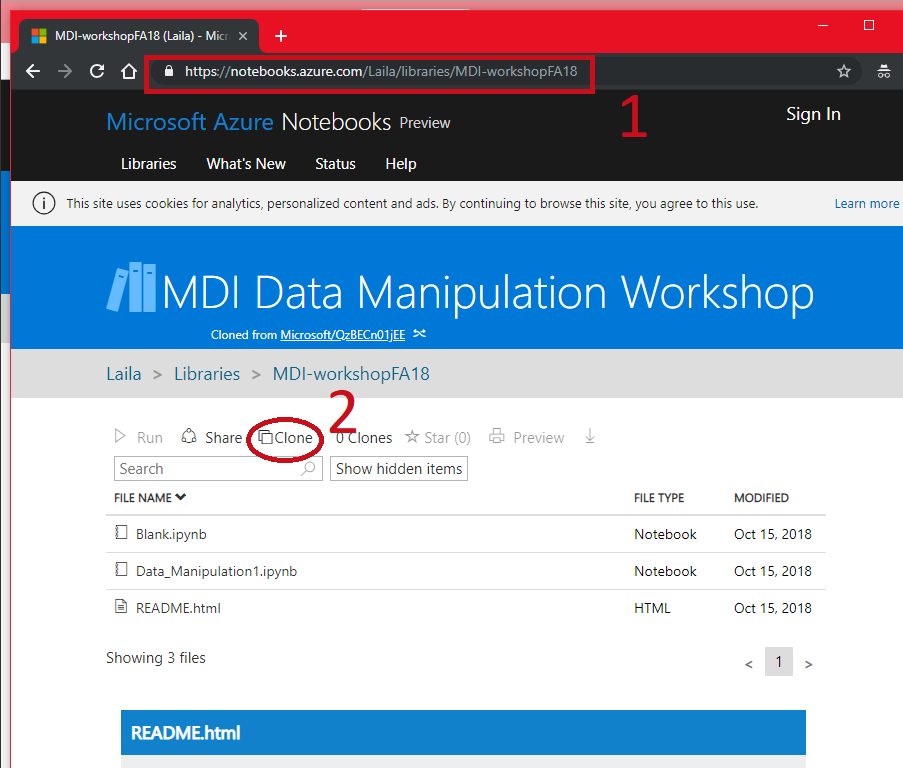
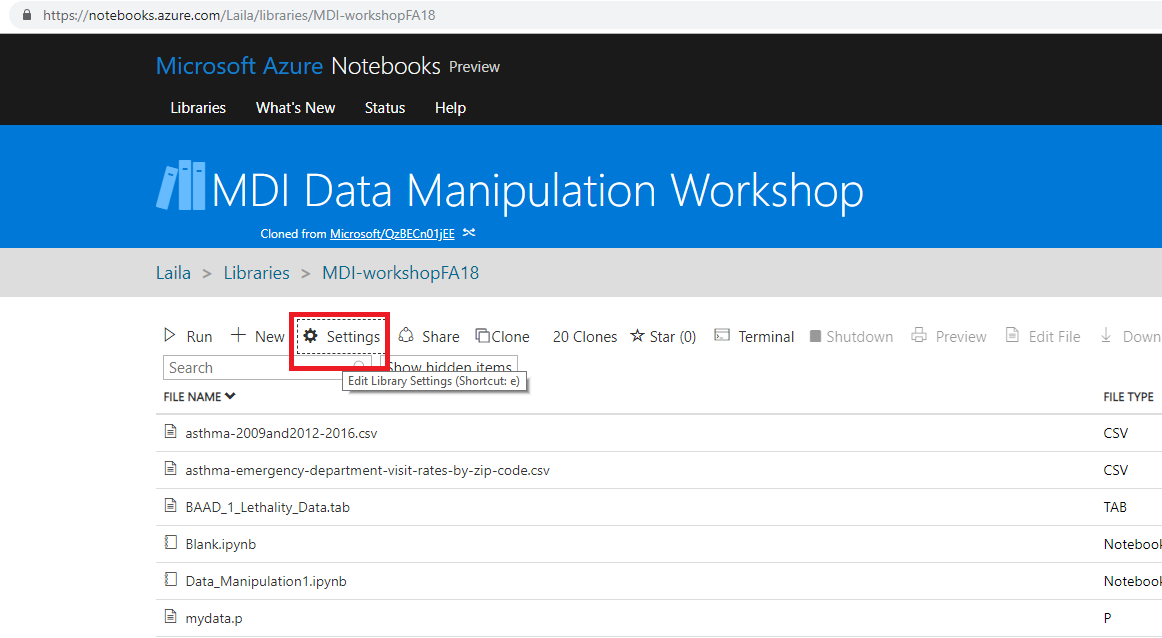
Follow Along¶
- Go to https://notebooks.azure.com/Laila/libraries/MDI-workshopFA18
- Clone the directory
Follow Along¶
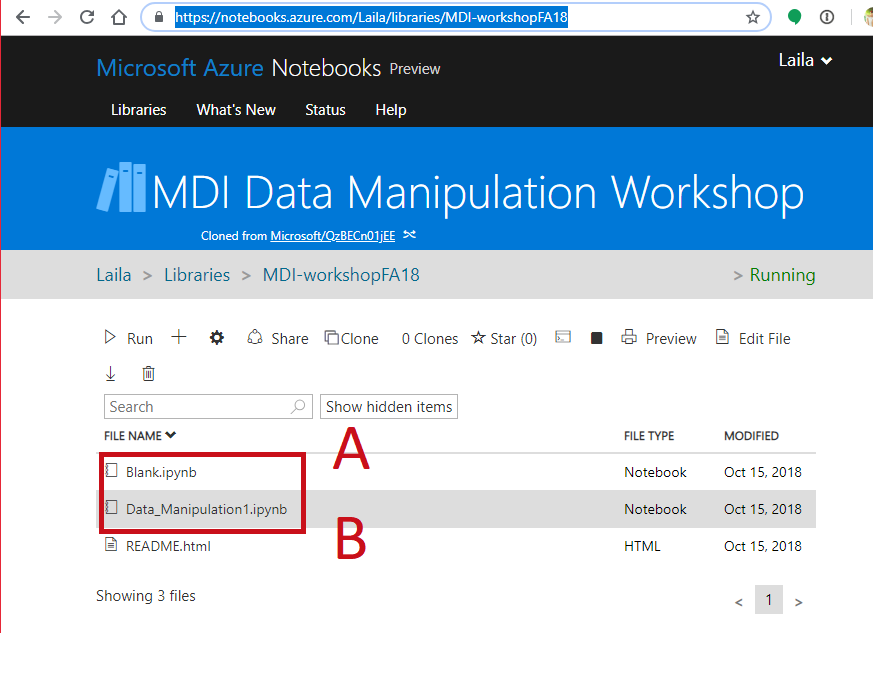
- Sign in with any Microsoft Account (Hotmail, Outlook, Azure, etc.)
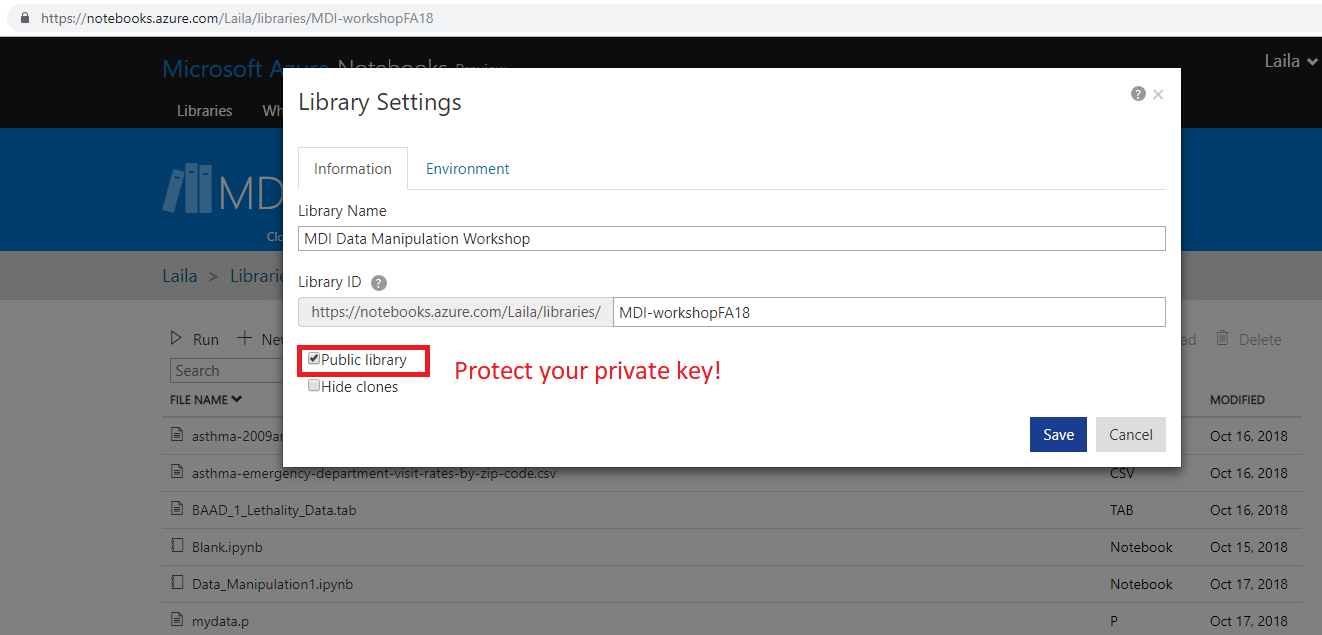
- Create a folder to put it in, mark as private or public

Follow Along¶
- Open a notebook
- Open this notebook to have the code to play with
- Data_collection_Analysis2.ipynb
- Open a blank notebook to follow along and try on your own.
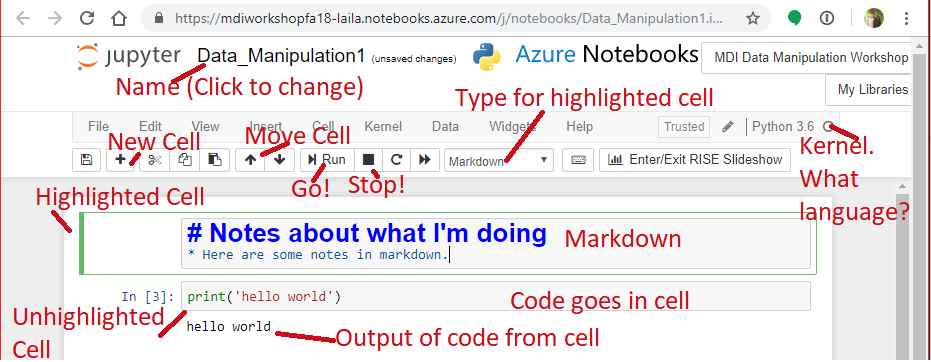
Your Environment¶
- Jupyter Notebook Hosted in Azure
- Want to install it at home?
- Install the Anaconda distribution of Python https://www.anaconda.com/download/
- Install Jupyter Notebooks http://jupyter.org/install
Agenda for today:¶
- Collect data from APIs
- Scrape data
- Merge data into a data frame
- Statsmodels package
- SKLearn package
Packages to Import For Today¶
- Should all be included with your Anaconda Python Distribution
- Raise your hand for help if you have trouble
- Our plots will use matplotlib, similar to plotting in matlab
- %matplotlib inline tells Jupyter Notebooks to display your plots
- from allows you to import part of a package
In [1]:
import pandas as pd
import numpy as np
import pickle
import statsmodels.api as sm
from sklearn import cluster
import matplotlib.pyplot as plt
%matplotlib inline
from bs4 import BeautifulSoup as bs
import requests
import time
# from ggplot import *
Other Useful Packages (not used today)¶
- ggplot: the familiar ggplot2 you know and love from R
- seaborn: Makes your plots prettier
- plotly: makes interactive visualizations, similar to shiny
- gensim: package for doing natural language processing
- scipy: used with numpy to do math. Generates random numbers from distributions, does matrix operations, etc.
Scraping¶
How the Internet Works¶
- Code is stored on servers
- Web addresses point to the location of that code
- Going to an address or clicking a button sends requests to the server for data,
- The server returns the requested content
- Your web browser interprets the code to render the web page
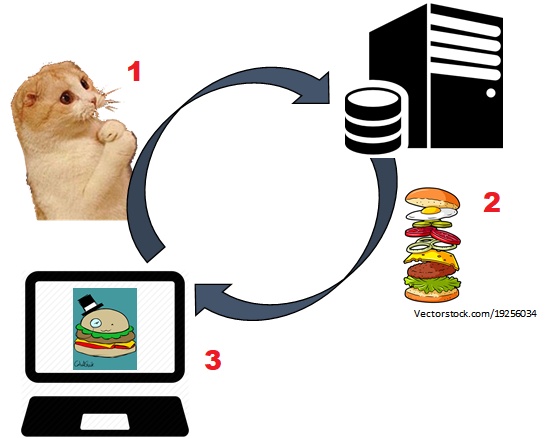
Scraping:¶
- Collect the website code by emulating the process:
- Can haz cheezburger?

- Can haz cheezburger?
- Extract the useful information from the scraped code:
- Where's the beef?

- Where's the beef?
API¶
Application Programming Interface¶
- The set of rules that govern communication between two pieces of code
- Code requires clear expected inputs and outputs
- APIs define required inputs to get the outputs in a format you can expect.
- Easier than scraping a website because gives you exactly what you ask for
API Keys¶
APIs often require identification¶
- Go to https://docs.airnowapi.org
- Register and get a key
- Log in to the site
- Select web services
DO NOT SHARE YOUR KEY¶
- It will get stolen and used for malicious activity
Requests to a Server¶
GET
- Requests data from the server
- Encoded into the URL

POST
- Submits data to be processed by the server
- For example, filter the data
- Can attach additional data not directly in the url

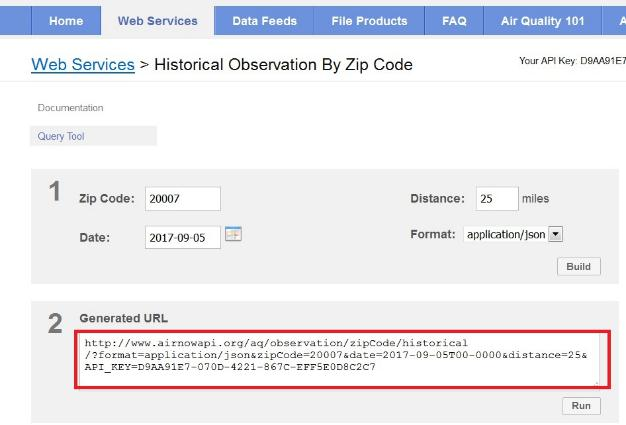
Requests encoded in the URL¶
Parsing a URL¶
http://www.airnowapi.org/aq/observation/zipCode/historical/?
format=application/json&
zipCode=20007&
date=2017-09-05T00-0000&
distance=25&
API_KEY=D9AA91E7-070D-4221-867CC-XXXXXXXXXXX
The base URL or endpoint is:
http://www.airnowapi.org/aq/observation/zipCode/historical/? tells us that this is a query.
& separates name, value pairs within the request.
Five name, value pairs POSTED
- format, zipCode, date, distance, API_KEY
In [3]:
base_url = "http://www.mywebsite.com/data/api?"
attributes = ["key1=value1",
            "key2=value2",
            "API_KEY=39DC3727-09BD-XXXX-XXXX-XXXXXXXXXXXX"
             ]
post_url = '&'.join(attributes)
print(base_url+post_url)
Prepare another URL on your own¶
In [4]:
base_url = "http://www.airnowapi.org/aq/observation/zipCode/historical/"
attributes = ["format=application/json",
            "zipCode=20007",
            "date=2017-09-05T00-0000",
            "distance=25",
            "API_KEY=39DC3727-09BD-48C4-BBD8-XXXXXXXXXXXX"
             ]
post_url = '&'.join(attributes)
print(base_url+post_url)
Where did the ? go?¶
Requests from Python¶
- Use requests package
- .get(url,post) for get and post requests
- First parameter: url for get request
- Optional second parameter: post data if doing a post request
- Requests posts the data to the url, so you don't need to add a ? to the base url
- Leave the post data out for a get request instead of a post request
- Requested json format
- Returns list of dictionaries
- Look at the returned keys
In [17]:
ingredients=requests.get(base_url, post_url)
ingredients = ingredients.json()
print(ingredients[0])
View Returned Data:¶
- Each list gives a different parameter for zip code and date we searched
In [18]:
for item in ingredients:
           AQIType = item['ParameterName']
           City=item['ReportingArea']
           AQIValue=item['AQI']
           print("For Location ", City, " the AQI for ", AQIType, "is ", AQIValue)
Ethics¶
- Check the websites terms of use
- Don't hit too hard:
- Insert pauses in your code to act more like a human
- Scraping can look like an attack
- Server will block you without pauses
- APIs often have rate limits
- Use the time package to pause for a second between hits
In [ ]:
time.sleep(1)
Review from last week: Asthma Data¶
- Load asthma data from csv
- Display a few rows
- Fix the zip codes
- Pivot to have one row per zip code (repeated rows for children, adults, all)
Load from csv, display¶
In [7]:
asthma_data = pd.read_csv('asthma-emergency-department-visit-rates-by-zip-code.csv')
asthma_data.head(2)
Out[7]:
Fix the zip codes¶
- Fix zip codes
In [8]:
asthma_data[['zip','coordinates']] = asthma_data.loc[:,'ZIP code'].str.split(
                                                        pat='\n',expand=True)
asthma_data.drop('ZIP code', axis=1,inplace=True)
asthma_data.head(2)
Out[8]:
Pivot the data so age group are columns¶
In [9]:
asthma_unstacked = asthma_data.pivot_table(index = ['Year',
                                                    'zip',
                                                    'County',
                                                    'coordinates',
                                                    'County Fips code'],
                                           columns = 'Age Group',
                                           values = 'Number of Visits')
asthma_unstacked.reset_index(drop=False,inplace=True)
asthma_unstacked.head(2)
Out[9]:
Now we have some zip codes!¶
Automate Data Collection¶
- Request the data for those zipcodes on a day in 2015 (you pick, fire season July-Oct)
- Be sure to sleep between requests
- Store that data as you go into a dictionary
- Key: zip code
- Value: Dictionary of the air quality parameters and their value
In [ ]:
base_url = "http://www.airnowapi.org/aq/observation/zipCode/historical/"
zips = asthma_unstacked.zip.unique()
zips = zips[:450]
date ="date=2015-09-01T00-0000"
api_key = "API_KEY=39DC3727-09BD-48C4-BBD8-XXXXXXXXXXXX"
return_format = "format=application/json"
zip_str = "zipCode="
post_url = "&".join([date,api_key,return_format,zip_str])
data_dict = {}
for zipcode in zips:
    time.sleep(1)
    zip_post = post_url + str(zipcode)
    ingredients = requests.get(base_url, zip_post)
    ingredients = ingredients.json()
    zip_data = {}
    for data_point in ingredients:
        AQIType = data_point['ParameterName']
        AQIVal = data_point['AQI']
        zip_data[AQIType] = AQIVal
    data_dict[zipcode]= zip_data
Scraping: Parsing HTML¶
- What about when you don't have an API that returns dictionaries?
- HTML is a markup language that displays data (text, images, etc)
- Puts content within nested tags to tell your browser how to display it
<Section_tag>¶
<tag> Content </tag>
<tag> Content </tag>
< /Section_tag>¶
<Section_tag>¶
<tag> Beef </tag>
< /Section_tag>¶
Find the tags that identify the content you want:¶
- First paragraph of wikipedia article: https://en.wikipedia.org/wiki/Data_science
- Inspect the webpage:
- Windows: ctrl+shift+i
- Mac: ctrl+alt+i
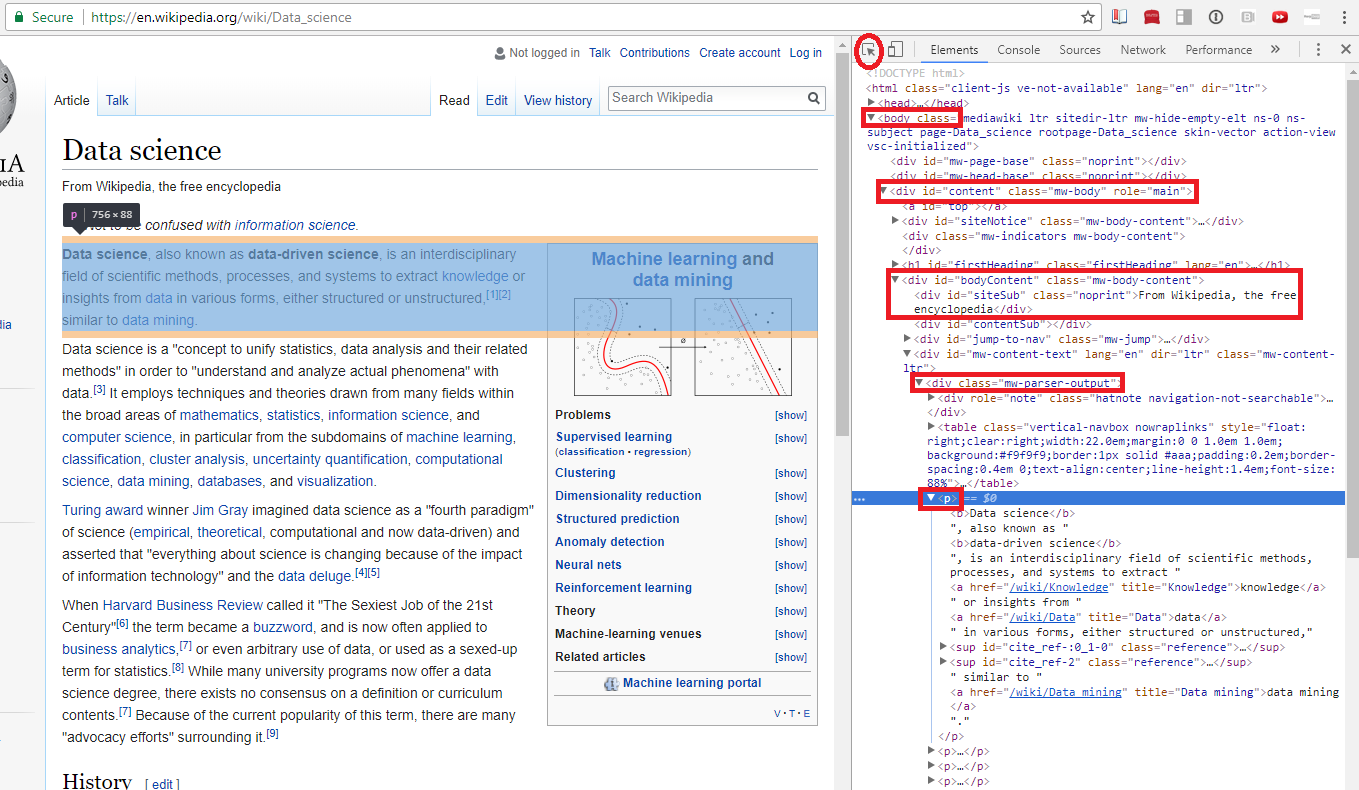
Parsing HTML with Beautiful Soup¶
Beautiful Soup takes the raw html and parses the tags so you can search through them.¶
- text attribute returns raw html text from requests
- Ignore the warning, default parser is fine
- We know it's the first paragraph tag in the body tag, so:
- Can find first tag of a type using .
- What went wrong?
In [24]:
ingredients = requests.get("https://en.wikipedia.org/wiki/Data_science")
soup = bs(ingredients.text)
print(soup.body.p)
Use Find Feature to Narrow Your Search¶
- Find the unique div we identified
- Remember the underscore: "class_"
- Find the p tag within the resulting html
- Use an index to return just the first paragraph tag
- Use the text attribute to ignore all the formatting and link tags
In [15]:
parser_div = soup.find("div", class_="mw-parser-output")
wiki_content = parser_div.find_all('p')
print(wiki_content[1])
print('*****************************************')
print(wiki_content[1].text)
List Contents¶
In [28]:
parser_div = soup.find("div", id="toc")
wiki_content = parser_div.find_all('ul')
for item in wiki_content:
    print(item.text)
Get All Links in the History Section¶
- Hint: chrome's inspect replaces "&" with "&" in links
In [56]:
wiki_content = soup.find_all('a',href=True)
in_hist = False
links = []
for l in wiki_content:
link = l['href']
if link == '/w/index.php?title=Data_science&action=edit§ion=2':
in_hist = False
if in_hist:
links.append(link)
if link =="/w/index.php?title=Data_science&action=edit§ion=1":
in_hist = True
print(links)
Use a for loop and scrape the first paragraph from a bunch of wikipedia articles¶
- Add your own subjects
In [20]:
topics = ['Data_scraping','Machine_learning','Statistics','Linear_algebra',
         'Cluster_analysis','Scientific_modelling','Analysis','Linear_regression']
base_url = 'https://en.wikipedia.org/wiki/'
paragraphs = []
for topic in topics:
    url = base_url.format(topic)
    ingredients = requests.get(base_url+topic)
    soup = bs(ingredients.text)
    parser_div = soup.find("div", class_="mw-parser-output")
    wiki_content = parser_div.find_all('p')
    for p in range(10):
        if len(wiki_content[p].text)>10:
            paragraphs.append(wiki_content[p].text)
            break
    time.sleep(1)
print(dict(zip(topics,paragraphs)))
Back To Our Data¶
- If it's still running, go ahead and stop it by pushing the square at the top of the notebook:
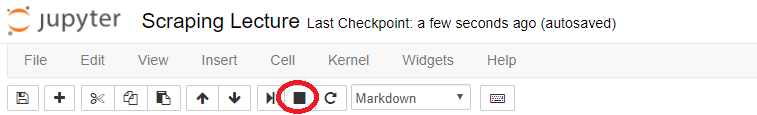
- Save what you collected, don't want to hit them twice!
In [61]:
pickle.dump(data_dict,open('AQI_data_raw.p','wb'))
Subset down to the data we have:¶
- use the isin() method to include only those zip codes we've already collected
In [63]:
collected = list(data_dict.keys())
asthma_2015_sub = asthma_unstacked.loc[(asthma_unstacked.zip.isin(collected))&
                                       (asthma_unstacked.Year == 2015),:]
Create a dataframe from the new AQI data¶
In [184]:
aqi_data = pd.DataFrame.from_dict(data_dict, orient='index')
aqi_data.reset_index(drop=False,inplace=True)
aqi_data.rename(columns={'index':'zip'},inplace=True)
aqi_data.head()
Out[184]:
Combine The Data¶
https://pandas.pydata.org/pandas-docs/stable/generated/pandas.DataFrame.merge.html
- Types of merges:
- Left: Use only rows from the dataframe you are merging into
- Right: use only rows from the dataframe you are inserting, (the one in the parentheses)
- Inner: Use only rows that match between both
- Outer: Use all rows, even if they only appear in one of the dataframes
- On: The variables you want to compare
- Specify right_on and left_on if they have different names
In [207]:
asthma_aqi = asthma_2015_sub.merge(aqi_data,how='outer',on='zip')
asthma_aqi.rename(columns = {'Adults (18+)':'Adults',
                             'All Ages':'Incidents',
                             'Children (0-17)':'Children'},inplace=True)
asthma_aqi.head(2)
Out[207]:
Look At The Data: Histogram¶
- 20 bins
In [186]:
asthma_aqi.Incidents.plot.hist(20)
Out[186]:

Look At The Data: Smoothed Distribution¶
In [187]:
asthma_aqi.loc[:,['Incidents','OZONE']].plot.density()
Out[187]:

Look at particulates¶
- There is a lot of missingness in 2015
- Try other variables, such as comparing children and adults
In [188]:
asthma_aqi.loc[:,['PM2.5','PM10']].plot.hist()
Out[188]:

Scatter Plot¶
- Try some other combinations
- Our data look clustered, but we'll ignore that for now
In [189]:
asthma_aqi.plot.scatter('OZONE','PM2.5')
Out[189]:

Run a regression:¶
- Note: statsmodels supports equation format like R
http://www.statsmodels.org/dev/example_formulas.html
In [200]:
y =asthma_aqi.loc[:,'Incidents']
x =asthma_aqi.loc[:,['OZONE','PM2.5']]
x['c'] = 1
ols_model1 = sm.OLS(y,x,missing='drop')
results = ols_model1.fit()
print(results.summary())
pickle.dump([results,ols_model1],open('ols_model_results.p','wb'))
Evaluate the model with some regression plots¶
Partial Regressions to see effect of each variable¶
In [191]:
fig = plt.figure(figsize=(12,8))
fig = sm.graphics.plot_partregress_grid(results, fig=fig)

Population confound¶
- Fires spread in less populated areas
- Fewer people to have asthma attacks in less populated areas
- Collect population data
- Use pandas to read the html table directly
In [208]:
ingredients = requests.get('https://www.california-demographics.com/zip_codes_by_population')
soup = bs(ingredients.text)
table = soup.find("table")
population = pd.read_html(str(table),flavor='html5lib')[0]
population.rename(columns=population.iloc[0],inplace=True)
population.drop(labels=0, axis=0,inplace=True)
population.head(2)
Out[208]:
Fix zipcode column¶
- Split doubled up zip codes into separate lines
In [209]:
population[['zip','zip2']]=population.loc[:,'Zip Code'].str.split(
                                                    pat =' and ',
                                                    expand=True)
population.Population = population.Population.astype(np.float)
population.loc[population.zip2!=None,'Population']=population.loc[population.zip2!=None,'Population']/2
temp_pop = population.loc[population.zip!=None,['Population','zip2']].copy()
temp_pop.rename(columns={'zip2':'zip'},inplace=True)
population = pd.concat([population.loc[:,['Population','zip']],
                        temp_pop],axis=0)
population.head(2)
Out[209]:
Re-run Regression¶
- With population
- Without PM2.5
In [210]:
asthma_aqi = asthma_aqi.merge(population,how='left',on='zip')
y =asthma_aqi.loc[:,'Incidents']
x =asthma_aqi.loc[:,['OZONE','Population']]
x['c'] = 1
glm_model = sm.GLM(y,x,missing='drop',family=sm.families.Poisson())
ols_model2 = sm.OLS(y,x,missing='drop')
glm_results = glm_model.fit()
results = ols_model2.fit()
print(glm_results.summary())
pickle.dump([glm_results,glm_model],open('glm_model_pop_results.p','wb'))
Poisson Regression¶
- Summary above was a Poisson regression instead of ols.
- Use GLM() to run a generalized linear model instead of an ols
- Specify the type of regression with family. We have count data, so:
- sm.GLM(y,x,missing='drop',sm.families.Poisson())
- GLMs don't have all the fancy diagnostic plots, so we'll continue with ols results for now.
Partial Regressions¶
In [211]:
fig = plt.figure(figsize=(12,8))
fig = sm.graphics.plot_partregress_grid(results, fig=fig)

Influence plot for outsized-effect of any observations¶
In [212]:
fig, ax = plt.subplots(figsize=(12,8))
fig = sm.graphics.influence_plot(results, ax=ax, criterion="cooks")

Diagnostic plots¶
In [204]:
fig = plt.figure(figsize=(12,8))
fig = sm.graphics.plot_regress_exog(results, "OZONE", fig=fig)

SciKitLearn¶
- Package for machine learning models
- Structured like statsmodels:
- Create a model
- Train on data
- Output results object
- Very good documentation:
Clustering¶
- Learn more about clustering here:
http://scikit-learn.org/stable/modules/clustering.html - Many algorithms, each good in different contexts

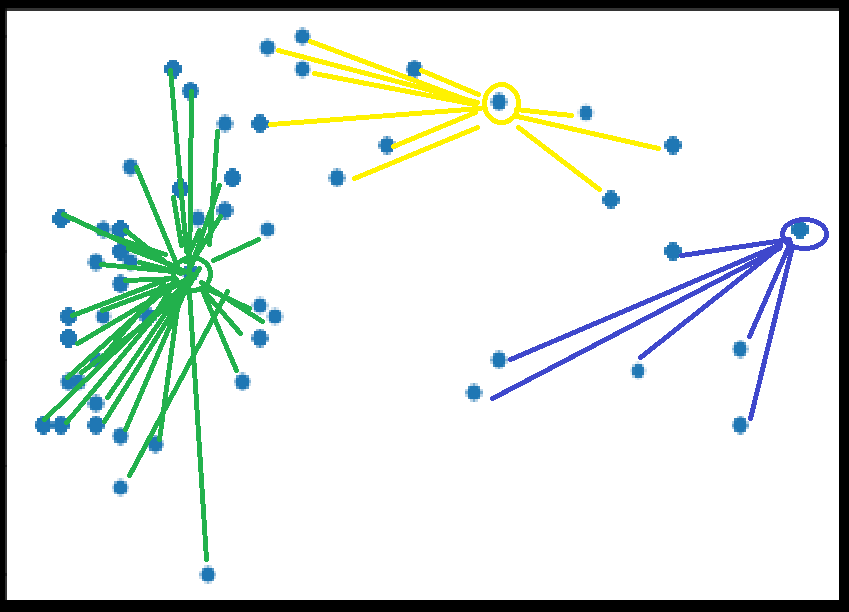
K-Means
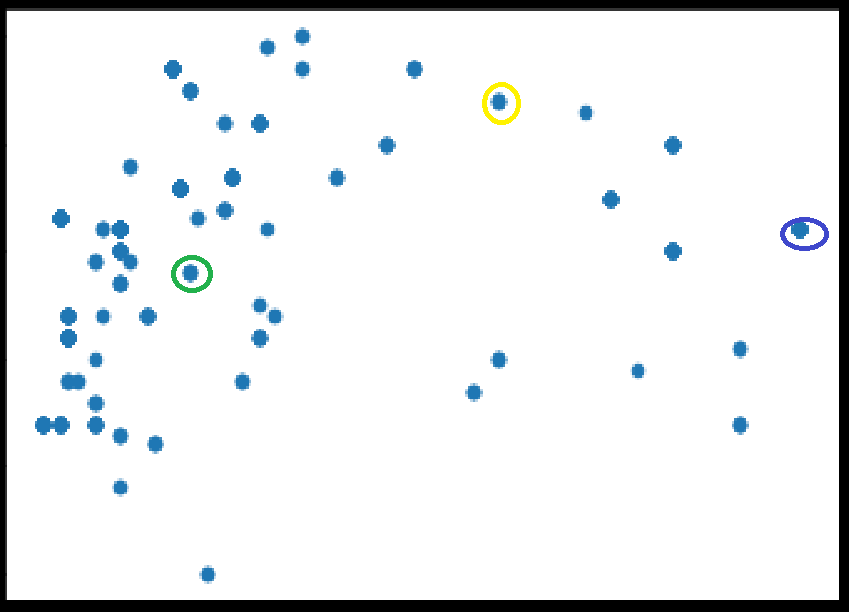
Randomly pick k initial centroids
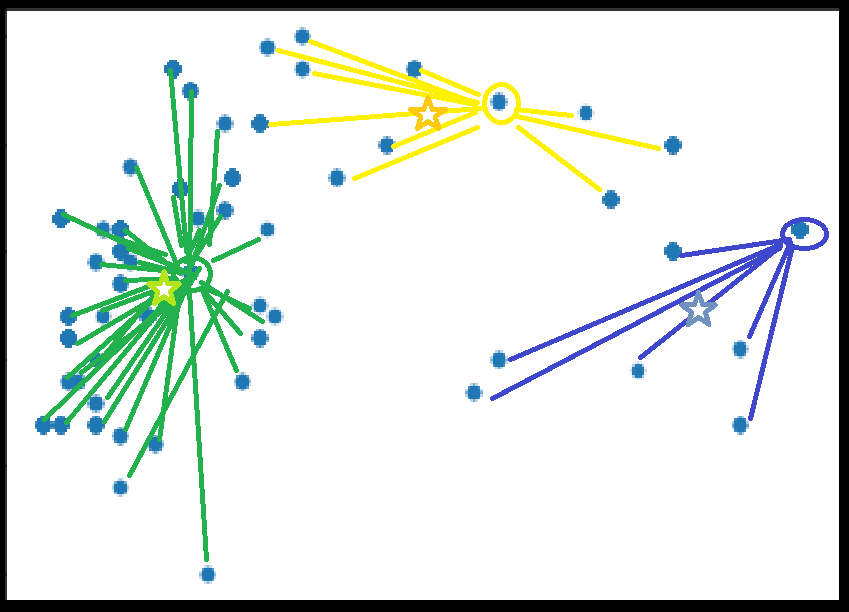
K-Means
Assign all points to nearest centroids
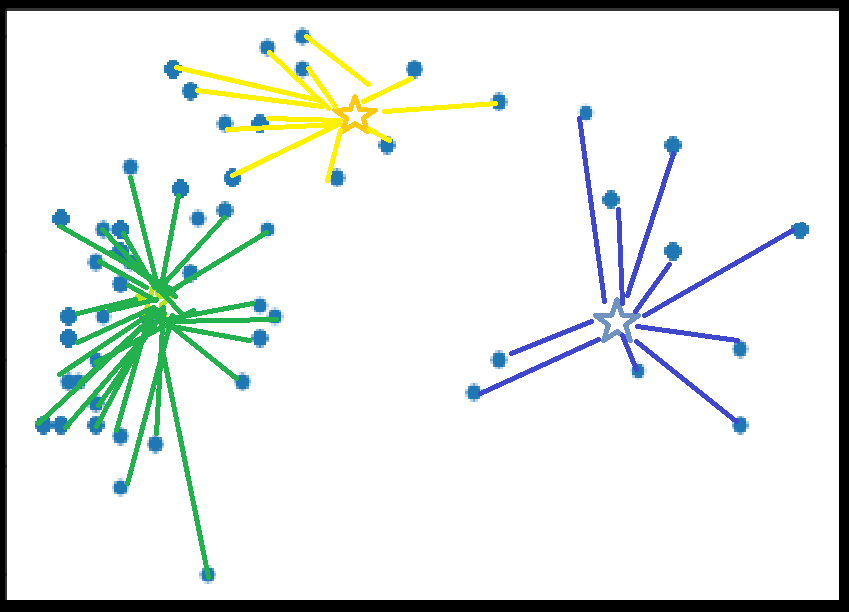
K-Means
Calculate new centroids for each set
K-Means
Assign all points to nearest centroid
K-Means
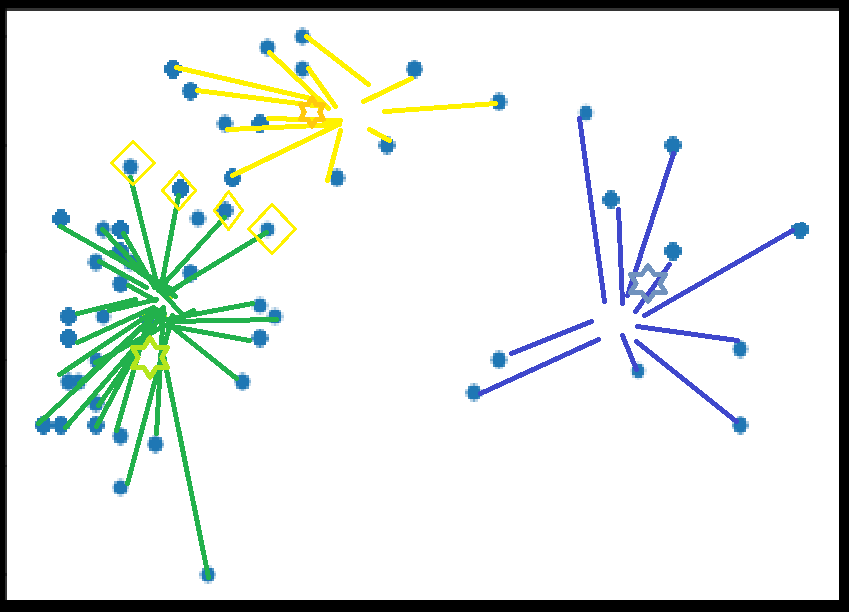
Calculate new centroids, assign points, continue until no change
Prepare data¶
- Statsmodels default drops null values
- Drop rows with missing values first
- Standardize the data so they're all on the same scale
In [325]:
model_df = asthma_aqi.loc[:,['OZONE','PM2.5','Incidents',]]
model_df.dropna(axis=0,inplace=True)
model_df = (model_df - model_df.mean()) / (model_df.max() - model_df.min())
Create and train the model¶
- Initialize a model with three clusters
- fit the model
- extract the labels
In [ ]:
asthma_air_clusters=cluster.KMeans(n_clusters = 3)
asthma_air_clusters.fit(model_df)
model_df['clusters3']=asthma_air_clusters.labels_
Look At Clusters¶
- Our data are very closely clustered, OLS was probably not appropriate.
In [326]:
from mpl_toolkits.mplot3d import Axes3D
fig = plt.figure(figsize=(4, 3))
ax = Axes3D(fig, rect=[0, 0, .95, 1], elev=48, azim=134)

labels = asthma_air_clusters.labels_

ax.scatter(model_df.loc[:, 'PM2.5'], model_df.loc[:, 'OZONE'], model_df.loc[:, 'Incidents'],
           c=labels.astype(np.float), edgecolor='k')

ax.set_xlabel('Particulates')
ax.set_ylabel('Ozone')
ax.set_zlabel('Incidents')
Out[326]:

Your Turn¶
- Try a different number of clusters
- Add population data
- Try a different clustering algorithm
Until Next Time¶
