Collecting and Using Data in Python
Laila A. Wahedi, PhD
Massive Data Institute Postdoctoral Fellow
McCourt School of Public Policy
Follow along:
- Slides: http://Wahedi.us, Tutorial
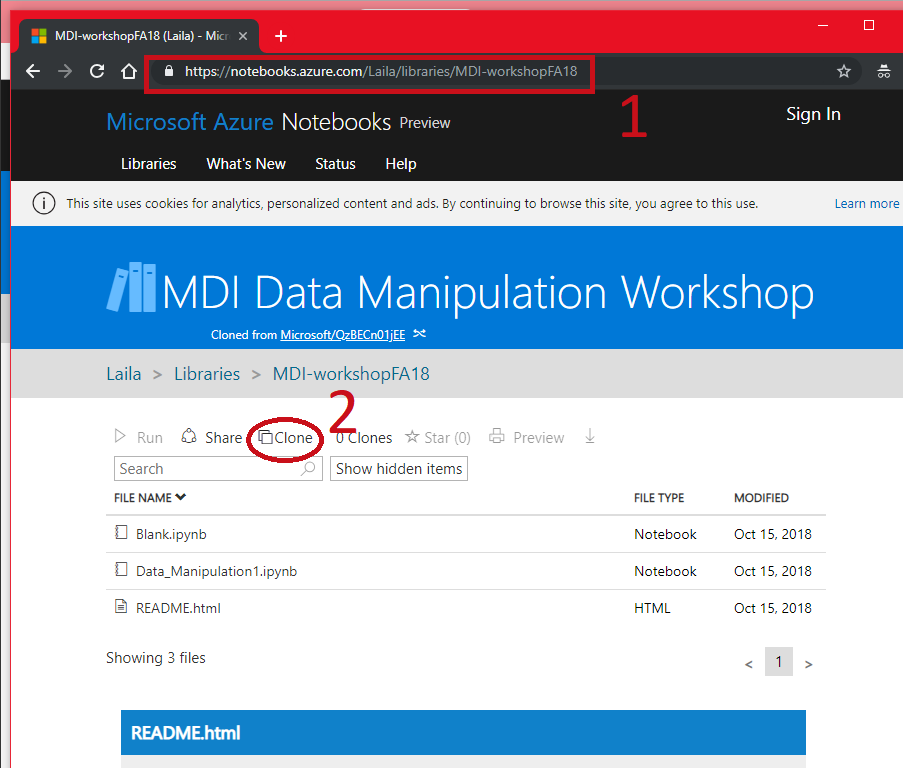
- Interactive Notebook: https://notebooks.azure.com/Laila/libraries/MDI-workshopFA18
Follow Along
- Go to https://notebooks.azure.com/Laila/libraries/MDI-workshopFA18
- Clone the directory
Follow Along
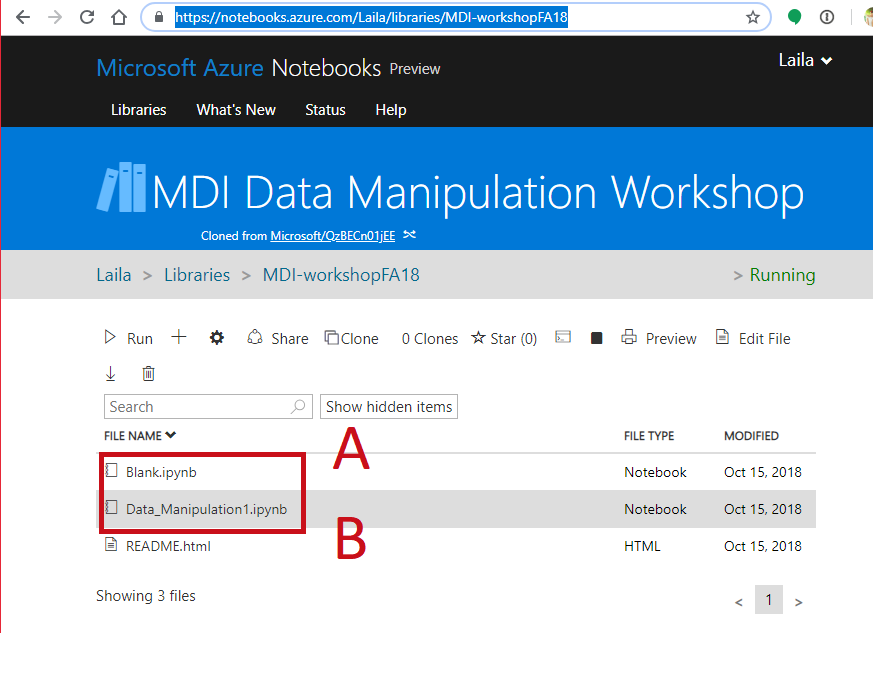
- Sign in with any Microsoft Account (Hotmail, Outlook, Azure, etc.)
- Create a folder to put it in, mark as private or public

Follow Along
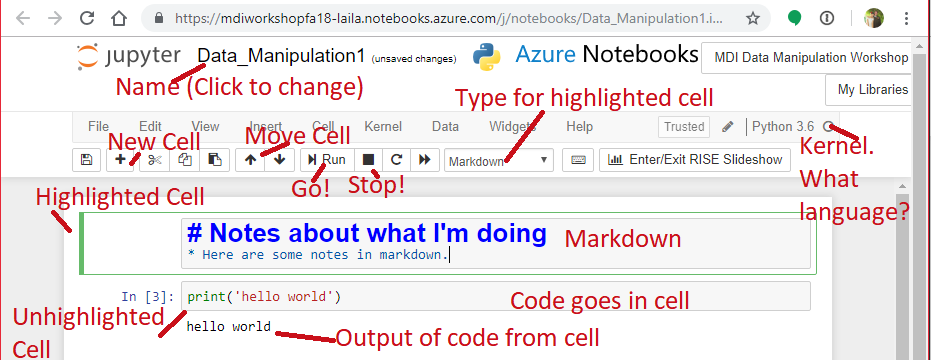
- Open a notebook
- Open this notebook to have the code to play with
- Open a blank notebook to follow along and try on your own.
Your Environment
- Jupyter Notebook Hosted in Azure
- Want to install it at home?
- Install the Anaconda distribution of Python https://www.anaconda.com/download/
- Install Jupyter Notebooks http://jupyter.org/install
Your Environment: Saving
- If your kernel dies, data are gone.
- Not R or Stata, you can't save your whole environment
- Data in memory more than spreadsheets
- Think carefully about what you want to save and how.
Easy Saving (more later)
- dump to save the data to hard drive (out of memory)
Contents of the command:
- variable to save,
- File to dump the variable into:
- open(
"name of file in quotes",
"wb") "Write Binary"
- open(
Note: double and single quotes both work
In [4]:
import pickle
mydata = [1,2,3,4,5,6,7,8,9,10]
pickle.dump(mydata, open('mydata.p','wb'))
Save more than one variable:
- Put them in a list
In [6]:
more_data = [10,9,8,7,6,5,4,3,2,1]
pickle.dump([mydata,more_data], open('so_much_data.p','wb'))
Loading the data from a pickle
- open(<"path to file">
"rb") "Read Binary" - Don't mix up rb and wb. wb will overwrite rb.
In [7]:
mydata = pickle.load(open("mydata.p",'rb'))
print(mydata)
Unpack the variables you saved on the fly
In [12]:
[mydata, more_data] = pickle.load(open('so_much_data.p','rb'))
print(mydata)
print(more_data)
Representing Data
- 1D Vectors of data in:
- Lists
- Arrays
- Series
Lists
- Square brackets []
- Can contain anything
- Ordered zero-indexing
- Slice with :
- Negatives to go backwards
- Third position to skip
In [119]:
my_list = [1,3,2,4,7,'Sandwich']
print(len(my_list))
print(my_list[0:2])
print(my_list[-1])
print(my_list[0:4:2])
Arrays in Numpy
- Like arrays from Matlab
- Vectors and multi-dimensional arrays
- Numpy and scipy do math functions, and output in arrays
- Index like lists
In [14]:
import numpy as np
my_array = np.random.poisson(lam=3,size=10)
print(my_array)
print(my_array.shape)
Series in Pandas
- Pandas is a package that creates labeled data frames
- Series are 1d Vectors
- Instantiate from list or array
- Built on Numpy
In [16]:
import pandas as pd
my_series = pd.Series(my_list)
my_series.shape
Out[16]:
Why Series: Label your data
In [17]:
my_series = pd.Series(my_array,
                      index = [1,2,3,'cat','dog','10','n',8,7,6])

print(my_series)
Why Series: Suite of tools
In [18]:
print(my_series.mean())
my_series = pd.Series(['hello world','hello planet'])
print(my_series.str.replace('hello','goodbye'))
Arrays Series and Lists Can Be Converted
In [20]:
new_list = list(my_array)
print(new_list)
Two Dimensions
- List of lists
- Dictionary of lists
- Array
- Pandas Data Frame
Lists of Lists (or tuples)
- Tuples are ordered collections like lists, but can't be changed once instantiated.
- Each item in list contains a row.
- Remember the position/order of your variables.
In [24]:
my_2d_list = [[1,4],[2,1],[8,10],[4,7],[9,2],[4,5]]
my_3var_list = [(1,4,7),(2,1,0),(8,10,2),(4,7,4),(9,2,7),(4,5,3)]
Add a variable from another list
- You can only add to a list of lists, not tuples
- Must be the proper order and same length
In [25]:
for i,new_var in enumerate(my_list):
    my_2d_list[i].append(new_var)
print(my_2d_list)
Keep Track of Variable Names With Dictionaries
- Curly Brackets
- Lots of memory, but search columns fast
- Easily add variables
- Index data with labels
In [90]:
my_dict = {
    'var1':[1,2,8,4,9,4],
    'var2': [4,1,10,7,2,5]
}
my_dict['var3']=my_list
print(my_dict['var3'])
Use numpy to maintain a matrix shape
- Instantiate a 2d array with a list of lists or tuples
- Each variable is a column, each internal list/tuple a row
- Index each dimension like a list, separated by a comma. [row,column]
In [120]:
my_matrix = np.array(my_2d_list)
my_other_matrix = np.array(my_3var_list)
print(my_matrix)
print(my_matrix[0,0:2])
Concatenate your matrices by stacking
- Axis = 0
In [37]:
big_matrix = np.concatenate([my_matrix, my_other_matrix],axis=0)
print(big_matrix)
Concatenate your matrices side by side
- Axis = 1
In [41]:
big_matrix = np.concatenate([my_matrix, my_other_matrix],axis=1)
print(big_matrix)
Do Matrix Operations
- Scalar multiplication
- Point-wise addition, subtraction, etc.
- Transpose
In [43]:
print(my_matrix.T + my_other_matrix.T*5)
Instantiate A Random Matrix For Simulations
- List of distributions here: https://docs.scipy.org/doc/numpy-1.14.0/reference/routines.random.html
In [126]:
my_rand_matrix = np.random.randn(5,3)
print(my_rand_matrix)
Index like a list with a comma between dimensions:
- [row,column]
- Each Column From A Different Normal Distribution:
- Multiply normal distribution by sigma, add mu
In [127]:
my_rand_matrix[:,0]=my_rand_matrix[:,0]*.5+5
my_rand_matrix[:,1]=my_rand_matrix[:,1]*.5-5
my_rand_matrix[:,2]=my_rand_matrix[:,2]*10+50
print(my_rand_matrix.T)
Sparse Matrices Save Memory When You Have Lots of Zeros
- Create a big empty array
- Create indexes to add values
- Add some values to each coordinate. e.g. place 4 in position (1,3,8)
In [128]:
BIG_array = np.zeros((100,100))
rows = (1,6,29,40,43,50)
columns = (3,6,90,58,34,88)
BIG_array[(rows,columns)]=[4,6,14,1,3,22]
Sparse Matrices Save Memory When You Have Lots of Zeros
- Turn the matrix into a sparse matrix
- Use scipy package
- Will turn itself back if too big
- Different types good for different things. See: https://docs.scipy.org/doc/scipy/reference/sparse.html
In [129]:
import scipy as sp
from scipy import sparse
BIG_array = sparse.csc_matrix(BIG_array)
print(BIG_array)
Maintain Shape AND Labels with Pandas
- DataFrames like R
- Lots of built in functions
- Instantiate from a dictionary...
In [130]:
df = pd.DataFrame(my_dict)
df
Out[130]:
Instantiate Your Data Frame...
- From a list of lists/tuples
In [131]:
df = pd.DataFrame(my_2d_list,
                 columns = ['var1','var2','var3'])
df
Out[131]:
Instantiate Your Data Frame...
- From a matrix
- Name your rows too!
In [132]:
df = pd.DataFrame(my_rand_matrix,
                  columns = ['dist_1','dist_2','dist_3'],
                 index = ['obs1','obs2','obs3','obs4','fred'])
df
Out[132]:

Summarize Your Data
In [133]:
df.describe()
Out[133]:
Look at your data with Matplotlib integration
- Matplotlib is like plotting in matlab
- Try ggplot package for ggplot2 in python
- See also Seaborn and Plotly
- Use some ipython magic to see plots inline
In [134]:
import matplotlib.pyplot as plt
%matplotlib inline
df.plot.density()
Out[134]:

One Variable At A Time:
In [135]:
df.dist_1.plot.hist(bins=3)
Out[135]:

Real Data
Load Data from a text file
- Start by googling it: http://lmgtfy.com/?q=pandas+load+csv
- Same method for comma (csv), tab (tab), |, and other separators
- Excel and R can both output spreadsheets to csv
We will use the Big Allied and Dangerous Data from START
In [95]:
baad_covars = pd.read_csv('BAAD_1_Lethality_Data.tab',sep='\t')
Look at the data
- Also try .tail()
In [96]:
baad_covars.head(3)
Out[96]:
Explore the data structure
In [76]:
print(baad_covars.shape)
baad_covars.columns
Out[76]:
Rename things and adjust values
- Use dictionaries to rename and replace
In [77]:
baad_covars.rename(columns = {'cowmastercountry':'country',
                              'masterccode':'ccode',
                       'mastertccode3606':'group_code',
                       'fatalities19982005':'fatalities'},
            inplace = True)
baad_covars.replace({'country':{'United States of America':'US'}},
            inplace = True)
print('Dimensions: ',baad_covars.shape)
baad_covars.head()
Out[77]:
Set a useful index
In [39]:
#Set the index
baad_covars.set_index(['group_code'],inplace = True)
baad_covars.head()
Out[39]:
Save Your Changes
- Save it to a usable spreadsheet instead of an unreadable binary
In [78]:
baad_covars.to_csv('updated_baad.csv')
Slicing
- Get specific values from the dataframe.
- Pandas has several slice operators.
- iloc can be used to index the row by ordered integer. i.e. first row is 0, second row is 1, etc. Use this option sparingly. Better practice to use the index you have created.
- loc uses the named index and columns.
- Index using [row, columns]
- Put your column names in a list
- Use : for all values
- Notice that the output keeps the index names.
In [40]:
baad_covars.loc[:, ['fatalities']].head()
Out[40]:
Slicing Using Conditionals
- Put conditionals in parentheses
- Stack multiple conditionals using:
- & when both conditions must always apply
- | when at least one condition must apply
In [41]:
baad_covars.loc[(baad_covars.fatalities>1) | (baad_covars.degree>=1),
               ['group','country']].head()
Out[41]:
Find a list of religious groups with territory
Find a list of religious groups with territory
In [102]:
baad_covars.loc[(baad_covars.ContainRelig==1)&
               (baad_covars.terrStrong==1),['group']]
Out[102]:
Plot a histogram of organization age with 20 bins
Plot a histogram of organization age with 20 bins
In [103]:
baad_covars.OrgAge.plot.hist(bins=10)
Out[103]:

Grouping By Variables
- Groupby(): List the variables to group by
- .function(): How to aggregate the rows
- Try: .count(), .mean(), .first(), .mode()
In [83]:
state_level = baad_covars.loc[:,['country','OrgAge',
                                     'ordsize','degree',
                                    'fatalities']
                                 ].groupby(['country']).sum()
state_level.head()
Out[83]:
In [62]:
baad_covars['big'] = 0
baad_covars.loc[(baad_covars.fatalities>1) |
                (baad_covars.degree>=1),
               'big']=1
baad_covars.big.head()
Out[62]:
In [54]:
print(type(np.nan))
baad_covars.loc[(baad_covars.fatalities>1) | (baad_covars.degree>=1),
               ['terrStrong']] = None
baad_covars.loc[(baad_covars.fatalities>1) | (baad_covars.degree>=1),
               ['terrStrong']].head()
Out[54]:
In [56]:
baad_covars.loc[baad_covars.terrStrong.isnull(),'terrStrong'].head()
Out[56]:
In [58]:
baad_covars['terrStrong'] = baad_covars.terrStrong.fillna(-77)
baad_covars.terrStrong.head()
Out[58]:
In [60]:
baad_covars_dropped = baad_covars.dropna(axis='index',
                                         subset=['terrStrong'],
                                        inplace=False)
Reindexing: Pop the index out without losing it
In [63]:
baad_covars.reset_index(inplace=True,
                       drop = False)
baad_covars.head()
Out[63]:
Set a multi-index
- Order Matters. What happens when you reverse group and country?
In [64]:
baad_covars.set_index(['group','country'],inplace = True)
baad_covars.head()
Out[64]:
Did you get an error?
- Don't forget to reset the index first!
- Go ahead and change it back for the next step.
Using the new index, make a new dataframe
- Note the new slicing operator for multi-index
In [65]:
indonesia_grps = baad_covars.xs('Indonesia',level = 'country',drop_level=False)
indonesia_grps = indonesia_grps.loc[indonesia_grps.fatalities>=1,['degree','ContainRelig',
                                            'ContainEthno','terrStrong',
                                            'ordsize','OrgAge']]
indonesia_grps.head()
Out[65]:
Warning: Making copies
- If you set a variable as equal to an object, Python creates a reference rather than copying the whole object. More efficient, unless you really want to make a copy
In [137]:
little_df = pd.DataFrame([1,2,3,4,5],columns = ['A'])
little_df['B']=[0,1,0,1,1]
copied_df = little_df
print('before:')
print(copied_df)
little_df.loc[little_df.A == 3,'B'] = 'Sandwich'
print('after')
print(copied_df)
What happened?
- copied_df changed when little_df changed.
- Let's fix that: import "copy"
In [139]:
import copy
little_df = pd.DataFrame([1,2,3,4,5],columns = ['A'])
little_df['B']=[0,1,0,1,1]
copied_df = little_df.copy()
print('before:')
print(copied_df)
little_df.loc[little_df.A == 3,'B'] = 'Sandwich'
print('after')
print(copied_df)
Merging and Concatenating
- Merges automatically if shared index
In [140]:
C = pd.DataFrame(['apple','orange','grape','pear','banana'],
                 columns = ['C'],
                 index = [2,4,3,0,1])
little_df['C'] = C
little_df
Out[140]:
Joins
- Same as SQL, inner and outer
In [141]:
C = pd.DataFrame(['apple','orange','grape','apple'],
                 columns = ['C'],
                 index = [2,4,3,'a'])
C['cuts']=['slices','wedges','whole','spirals']
print('C:')
print(C)
print('Inner: Intersection')
print(little_df.merge(right=C,
                how='inner',
                on=None,
                left_index = True,
                right_index =True))
print('Outer: Keep all rows')
print(little_df.merge(right=C,
                how='outer',
                on=None,
                left_index = True,
                right_index =True))

print('Left: Keep little_df')
print(little_df.merge(right=C,
                how='left',
                on=None,
                left_index = True,
                right_index =True))
print('Right: Keep C')
print(little_df.merge(right=C,
                how='right',
                on=None,
                left_index = True,
                right_index =True))

print('Outer, merging on column instead of index')
print(little_df.merge(right=C,
                how='outer',
                on='C',
                left_index = False,
                right_index =False))
Concatenate
- Stack dataframes on top of one another
- Stack dataframes beside one another
In [142]:
add_df = pd.DataFrame({'A':[6],'B':[7],'C':'peach'},index= ['p'])
little_df = pd.concat([little_df,add_df])
little_df
Out[142]:
Some New Messy Data: Asthma by Zip Code
- From California Health and Human Services
https://data.chhs.ca.gov/dataset/asthma-emergency-department-visit-rates-by-zip-code - Note: old version of data
In [107]:
asthma_data = pd.read_csv('asthma-emergency-department-visit-rates-by-zip-code.csv')
asthma_data.head(2)
Out[107]:
Look at those zip codes!
Clean Zip Code
- We don't need the latitude and longitude
- Create two variables by splitting the zip code variable:
- index the data frame to the zip code variable
- split it in two: https://pandas.pydata.org/pandas-docs/stable/generated/pandas.Series.str.split.html
- assign it to another two variables
- Remember: can't run this cell twice without starting over
In [108]:
asthma_data[['zip','coordinates']] = asthma_data.loc[:,'ZIP code'].str.split(
                                                        pat='\n',expand=True)
asthma_data.drop('ZIP code', axis=1,inplace=True)
asthma_data.head(2)
Out[108]:
Rearrange The Data: Group By
- Make child and adult separate columns rather than rows.
- Must specify how to aggregate the columns
https://pandas.pydata.org/pandas-docs/stable/generated/pandas.DataFrame.groupby.html
In [109]:
asthma_grouped = asthma_data.groupby(by=['Year','zip']).sum()
asthma_grouped.head(4)
Out[109]:
Lost Columns! Fips summed!
Group by: Cleaning Up
- Lost columns you can't sum
- took sum of fips
- Must add these back in
- Works because temp table has same index
In [110]:
asthma_grouped.drop('County Fips code',axis=1,inplace=True)
temp_grp = asthma_data.groupby(by=['Year','zip']).first()
asthma_grouped[['fips',
                'county',
                'coordinates']]=temp_grp.loc[:,['County Fips code',
                                                'County',
                                                'coordinates']].copy()
asthma_grouped.loc[:,'Number of Visits']=\
        asthma_grouped.loc[:,'Number of Visits']/2
asthma_grouped.head(2)
Out[110]:
Rearrange The Data: Pivot
- Use pivot and melt to to move from row identifiers to column identifiers and back
https://pandas.pydata.org/pandas-docs/stable/reshaping.html#reshaping-by-melt - Tell computer what to do with every cell:
- Index: Stays the same
- Columns: The column containing the new column labels
- Values: The column containing values to insert
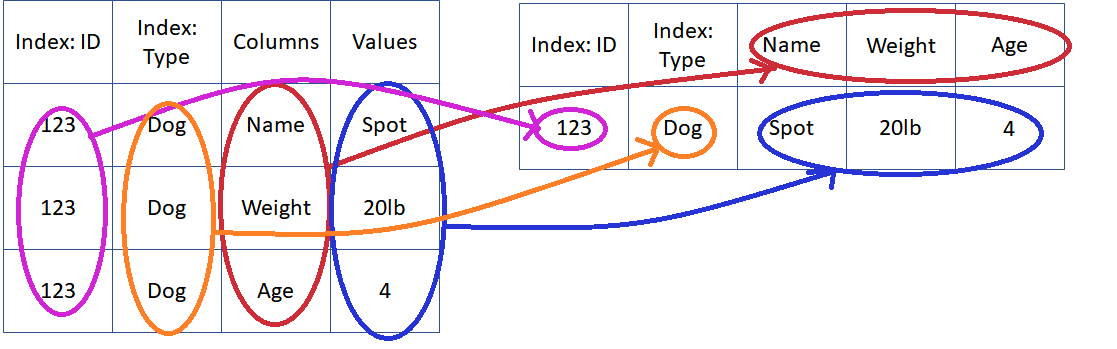
Rearrange The Data: Pivot
- Tell computer what to do with every cell:
- Index: Stays the same
- Columns: The column containing the new column labels
- Values: The column containing values to insert
In [111]:
asthma_unstacked = asthma_data.pivot_table(index = ['Year',
                                                    'zip',
                                                    'County',
                                                    'coordinates',
                                                    'County Fips code'],
                                           columns = 'Age Group',
                                           values = 'Number of Visits')
asthma_unstacked.reset_index(drop=False,inplace=True)
asthma_unstacked.head(2)
Out[111]:
Rename Columns, Subset Data
In [113]:
asthma_unstacked.rename(columns={
    'zip':'Zip',
    'coordinates':'Coordinates',
    'County Fips code':'Fips',
    'Adults (18+)':'Adults',
    'All Ages':'Incidents',
    'Children (0-17)': 'Children'
    },
    inplace=True)
asthma_2015 = asthma_unstacked.loc[asthma_unstacked.Year==2015,:]
asthma_2015.head(2)
Out[113]:
Save Your Data
Save Your Data
In [114]:
asthma_2015.to_csv('asthma_2015.csv')
See You Next Week!
<img src = "https://media.giphy.com/media/6VWz7mToYWdDNYglYr/giphy.gif">